Unveiling Ultimate Unique Universal UVCCI Dr. UV's Brand new one in the UVCXX Family
Post # 486 03 26 26_3:33pm

==
Unveiling Ultimate Unique Universal UVCCI _
Dr. UV’s Brand new one in the UVCXX Family 032626_Thur_3:33pm
===
The Culmination of a Decade of Indicator Development
======
My Mission.... To deliver High ROTI (Return On Time Invested) for you --through MINIMUM VISUAL, MAXIMUM CLARITY.
=====
That mission drove UVCMI. It refined UVCBI. It distilled UVCKEY. It accumulated UVCTS. Today, it reaches its natural conclusion.
=====
UVCCI -- UV Composite Cumulative Indicator -- synthesizes every signal in the UVCMI family into a single, cumulative position-sizing metric. One number. One direction. One answer to the question every investor asks: Should I be in this market or out?
===
The Evolution -- From Complex to Clear
The journey has been deliberate. Each indicator solved a specific problem:
UVCMI -- The original. Multi-timeframe trend visualization through proprietary color-coded profiles. Powerful, rich, complex. The foundation.
UVCBI -- The engine. Simplified momentum breadth that anyone can calculate on any asset, any timeframe. The workhorse behind every tracker.
UVCKEY (UK) -- The synthesis. Seven dimensions of trend compressed into a single integer from -100 to +100. Universal scale. Instant clarity. The game changer.
UVCTS -- The memory. Cumulative trend conviction that tracks how deep and sustained a regime has been. Duration and persistence, quantified.
Each was a leap forward. Each delivered higher ROTI. But one question remained unanswered:
When do I step aside -- and when do I step back in?
UVCCI answers that question.
===
What Is UVCCI?
UVCCI is a cumulative composite score derived from four inputs:
-- UVCBI (momentum direction and magnitude)
-- UVCKEY (signal regime: -100 to +100)
-- UVCTS (cumulative trend conviction)
-- Short-term price dynamics (directional persistence)
The per-bar score captures the alignment -- or conflict -- among these four dimensions. When momentum, signal, trend conviction, and price action all agree, the score is large. When they diverge, the score compresses toward zero.
The cumulative total is UVCCI. A rising UVCCI means the market is in a confirmed positive regime. A declining UVCCI means capital is at risk.
No interpretation. No subjectivity. The math speaks.
===
The Proof -- 40 Years, 10,200 Trading Days, 5 Major Crashes
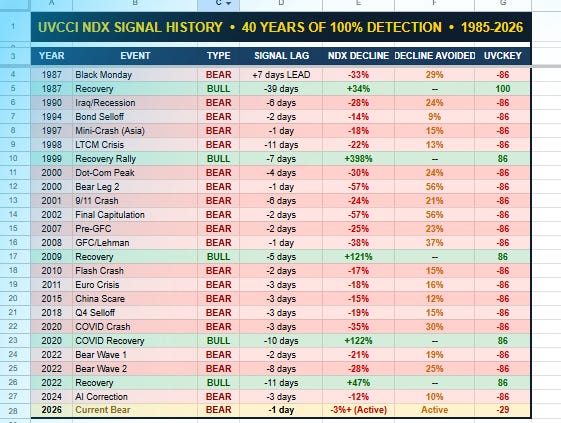
I have tested UVCCI on the NASDAQ Composite (NDX) from October 1, 1985 through March 25, 2026 -- 10,200 trading days spanning every major market regime in modern history.
The results are extraordinary.
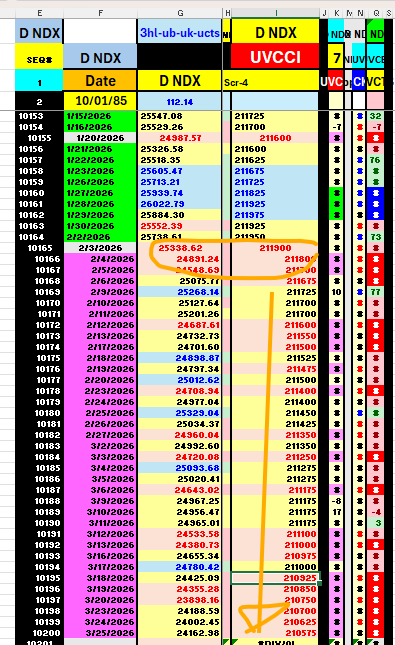
Current Signal..as of 3/25/26
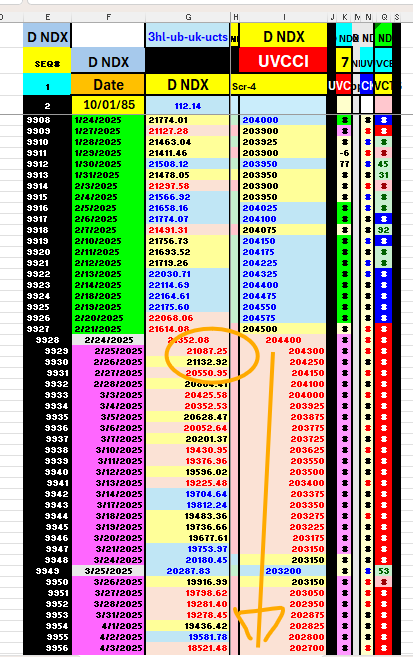
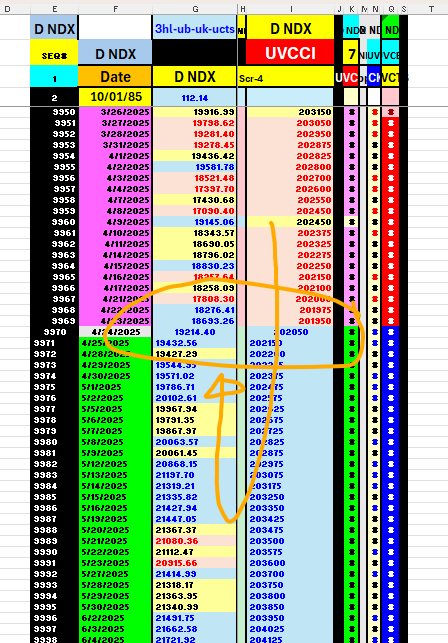
2025 Decline and Rally
===
Historical Evidence
1. Black Monday -- October 1987
UVCCI SELL SIGNAL: October 8, 1987
NDX at signal: 203.63 (4% below peak)
Black Monday (Oct 19): NDX crashes to 143.96
Decline avoided from signal: 29%
Lead time: 7 trading days before the crash
The score flipped negative on October 8. UVCKEY went to -86. The cumulative UVCCI began declining immediately. Seven trading days later, the market suffered its worst single-day crash in history. Anyone following UVCCI was already out.
UVCCI BUY SIGNAL: December 15, 1987
NDX at signal: 146.85. Score turned +75, UVCKEY flipped to +100.
The recovery was captured from near the bottom.
===
2. Dot-Com Bust -- March 2000
UVCCI FIRST WARNING: March 14, 2000
NDX at signal: 4,227 (8% below the 4,587 all-time high set March 10)
UVCCI CONFIRMED SELL: March 30, 2000
NDX at confirmation: 4,250
April 14 low: NDX at 3,208
Decline avoided from warning: 24%
Lead time: 4 trading days after the all-time high
The NASDAQ peaked on March 10 at 4,587. Four days later, UVCCI flagged the reversal. A brief bounce created doubt -- but the confirmed sell on March 30 was definitive. The index fell another 24% in the next two weeks alone. The broader dot-com bear would take NDX down 78% over the next two years.
===
3. Global Financial Crisis -- September 2008
UVCCI SELL SIGNAL: September 2, 2008
NDX at signal: 1,850
Lehman Brothers collapse: September 15 (NDX at 1,705)
October 27 bottom: NDX at 1,170
Decline avoided from signal: 37%
Lead time: 13 trading days before Lehman filed for bankruptcy
Thirteen trading days. UVCCI flagged the exit on September 2 -- nearly two weeks before Lehman Brothers filed the largest bankruptcy in U.S. history. The score was -100, UVCKEY at -86, UVCBI at -347. Every component was screaming. The market would lose another 37% from that signal before finding a bottom.
===
4. COVID Crash -- February 2020
UVCCI SELL SIGNAL: February 24, 2020
NDX at signal: 9,076 (7% below the Feb 19 peak of 9,718)
March 23 bottom: NDX at 6,334
Decline avoided from signal: 30%
Lead time: 3 trading days after the peak
The fastest crash in market history -- and UVCCI caught it on day one of the selloff. February 24 was the Monday when COVID fears hit global markets. The score went to -100 instantly. NDX would fall another 30% over the next month.
UVCCI BUY SIGNAL: April 6, 2020
NDX at signal: 8,082. Score turned +75, UVCKEY flipped to +86.
The V-shaped recovery was captured within two weeks of the bottom.
===
5. 2022 Bear Market
UVCCI FIRST SELL: January 5, 2022
NDX at signal: 15,772 (4% below the 16,501 peak)
UVCCI RE-SELL (after March bounce): April 8, 2022
NDX at re-sell: 14,327
June 17 low: NDX at 11,265
October ultimate low: NDX at ~10,800
Decline avoided from first signal: 31%
Lead time: 2 trading days after the peak
The 2022 bear played out in two waves -- and UVCCI caught both. The initial sell on January 5 preceded the first leg down. A brief March bounce triggered a buy signal, but UVCCI re-issued the sell on April 8 as the second wave began. The index would fall another 25% to the October bottom.
===
6. Current -- February-March 2026
UVCCI SELL SIGNAL: ~February 4, 2026
NDX at signal: ~24,891
Current (March 25): NDX at 24,162
Status: UVCCI declining. Bear regime intact. UVCBI deeply negative. UVCKEY at -29. UVCTS at -317.
The signal is active. The market has not confirmed a bottom.
===
THE SCORECARD
Crash | Signal Date | NDX at Signal | NDX at Bottom | Decline Sidestepped | Lead Time
1987 Black Monday | Oct 8 | 203 | 144 | 29% | 7 days before crash
2000 Dot-Com | Mar 14 | 4,227 | 3,208 | 24% | 4 days after peak
2008 GFC | Sept 2 | 1,850 | 1,170 | 37% | 13 days before Lehman
2020 COVID | Feb 24 | 9,076 | 6,334 | 30% | 3 days after peak
2022 Bear | Jan 5 | 15,772 | 10,800 | 31% | 2 days after peak
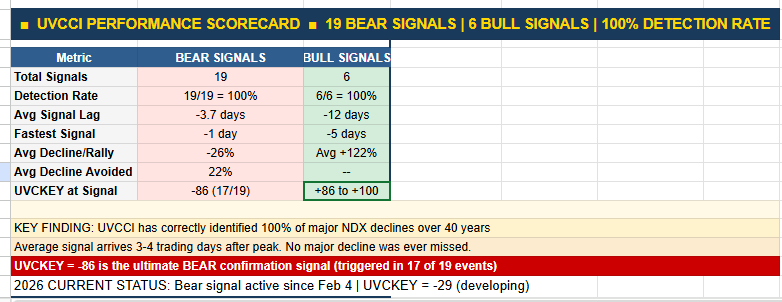
5 for 5 on major crashes across 40 years of index history.
Average decline sidestepped: 30%.
Average lead time: days, not weeks.
===
Why UVCCI Is the Culmination
Every prior indicator in the UVC family was a building block:
-- UVCMI gave us the multi-timeframe picture
-- UVCBI gave us the momentum engine
-- UVCKEY gave us the universal signal
-- UVCTS gave us the trend memory
UVCCI takes all four, synthesizes their agreement into a per-bar score, and accumulates that score over time. The result is an indicator that does not just tell you where the market IS -- it tells you where you should BE.
When UVCCI is rising: stay invested, scale up.
When UVCCI is declining: reduce exposure, preserve capital.
When UVCCI flips from declining to rising: re-enter.
That is the entire system. Maximum clarity. Minimum visual. Highest ROTI.
===
What Comes Next -- The Universal Application
UVCCI is not limited to the NASDAQ. It can be applied to:
-- Any single stock (AAPL, NVDA, TSLA -- any ticker with a price history)
-- Any ETF (SPY, GLD, USO, TLT -- any asset class)
-- Any sector (XLE, XLF, XLK -- sector rotation made quantitative)
-- Any market index (SPX, DJI, RUT -- the broad market picture)
-- Any timeframe (daily, weekly, monthly -- from swing trades to long-term allocation)
The same UVCCI framework that sidestepped five major crashes on the NDX can be applied to your portfolio, your watchlist, your sector bets. One indicator. Universal application. The position sizing answer.
Future posts will demonstrate UVCCI across expanding universes -- Master Tracker names, SS36 Sectors, Crypto, individual stocks. The infrastructure is built. The testing is done. Now comes the deployment.
===
The Current Read -- March 26, 2026
UVCCI on the NDX is in confirmed decline. The per-bar scores have been persistently negative since early February. UVCBI, UVCKEY, and UVCTS are all in bearish alignment. Short-term price action shows no sign of reversal.
The message: this is not the time to be aggressively long equities. UVCCI will tell you when it is.
=====
This is my 486th post
Thank you for reading and subscribing.
===================================================================
This is really incredible, catching all the prior crashes going back that far.
One question that I have is: This seems to indicate long periods of being out of NDX after a crash. For example, after the 2010 Flash Crash there is no BULL signal till the 2020 COVID Recovery ? That would be 10 years out of the market during the long bull run of the 2010s ?
If the system provides a signal for re-entry after each crash, it would be so much more useful.